Introduction
Molecular Infectious Diseases (MID) falls under the Microbiology Discipline but is specifically for the detection of infectious diseases using molecular techniques and technology. MID transitioned to the new RCPAQAP software platform in 2020 to structure survey programs, analyse survey results and assess performance. The report format follows the standard structure used by all programs offered by the RCPAQAP.
The following information provides participants with a guide to understand the data analysis system used to assess participant performance.
Survey Assessment and Reports
There are three types of assessment and reporting are used for MID, qualitative, qualitative & quantitative and identification programs which require grading.
The structure of the new reports provides participants with a summary of performance, a review of individual performance, a method breakdown review with commentary and cumulative performance.
Survey Reports for Multiplex programs (Qualitative)
The survey reports are structured to provide participants with a Summary of Performance, Result Review, commentary, and cumulative performance.
Summary of Performance – The summary of performance provides a snapshot of participation and assessment in the program. This section shows a table for the ‘method system used by a participant, the ‘expected results’ for each sample and the ‘performance assessment’. The summary also lists the expected results, your result, the assessment, total number of participants performing the test and displays the test method performed by the participant.
The assessment of results is based on the target (expected result), taking into consideration the assay in use to determine the pathogen. If an assay in use does not have the capability to detect the expected target and the result returned is not detected, the assessment grade of ‘Not assessed’ will be assigned.
The following nomenclature is currently in use for assessment
Concordant: Matches the target or expected result
Minor Discordance: A result that may have partial agreement to the target result
Discordant: Does not match the target response
Not Assessed: The result not within the assay capability or is beyond the scope of acceptance for grading
No Participation: The participant failed to take part in the survey
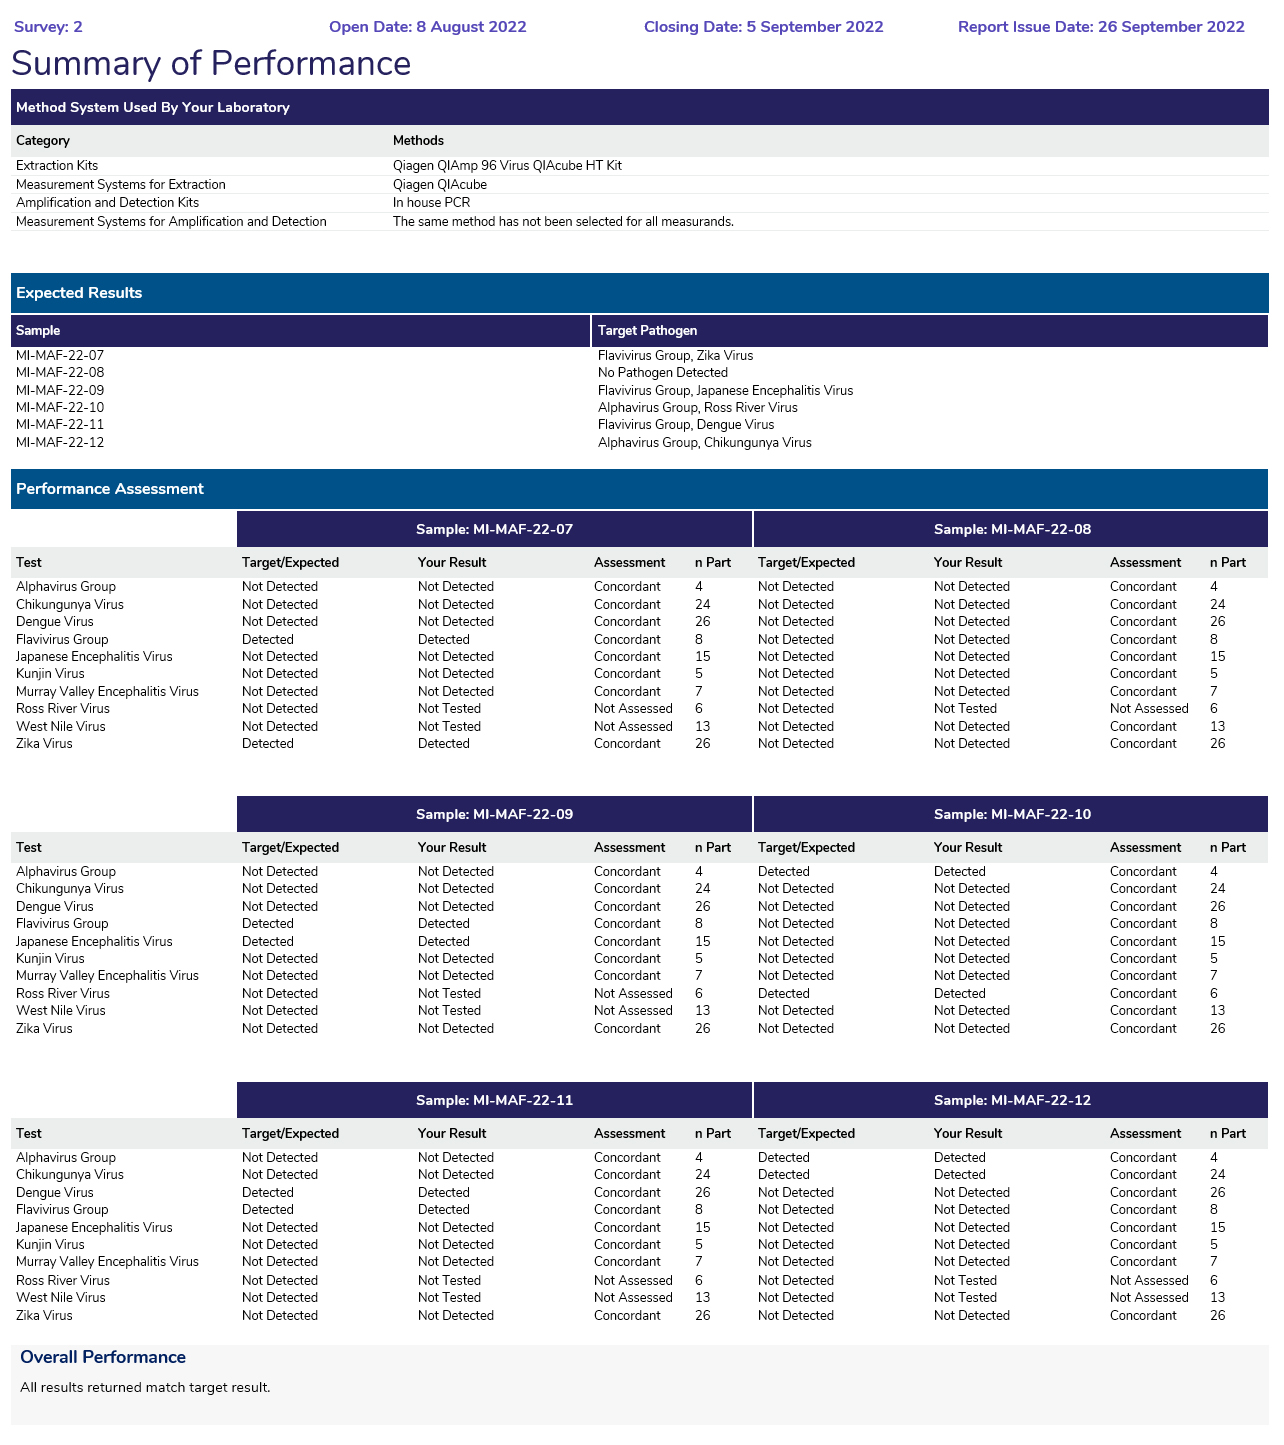
Summary of Performance: Displaying the method category supplied by the participant and the expected result for each survey sample. The Performance assessment provides a breakdown of the results returned by the participant, highlighting the assessment and the number of participants testing for the specific pathogen.
Result Review – The results for each sample are presented on a separate page, displaying a bar graph with your qualitative result highlighted as a blue dot (●), compared to all other participants (grey bar) and those using the same method (dark blue overlay). A scatter graph is provided adjacent to the interpretative responses, displaying quantitative results (if supplied) of the Ct value. These results are not assessed but can give an indication of performance. Below the bar graph and scatterplot is a table showing a breakdown of all assays in use and the results obtained.

Commentary – Provides a review of the survey results obtained for each sample. Suggestions and recommendations are provided for follow-up investigation and may also list some further reading for educational purpose.

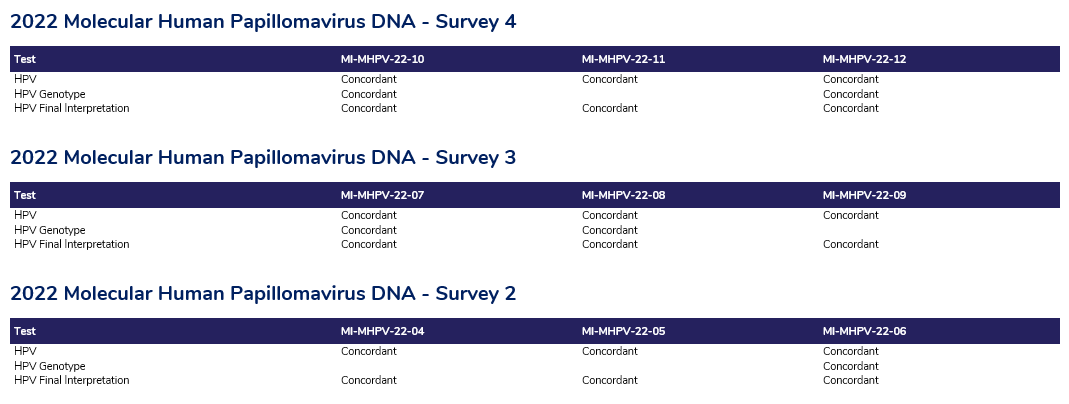
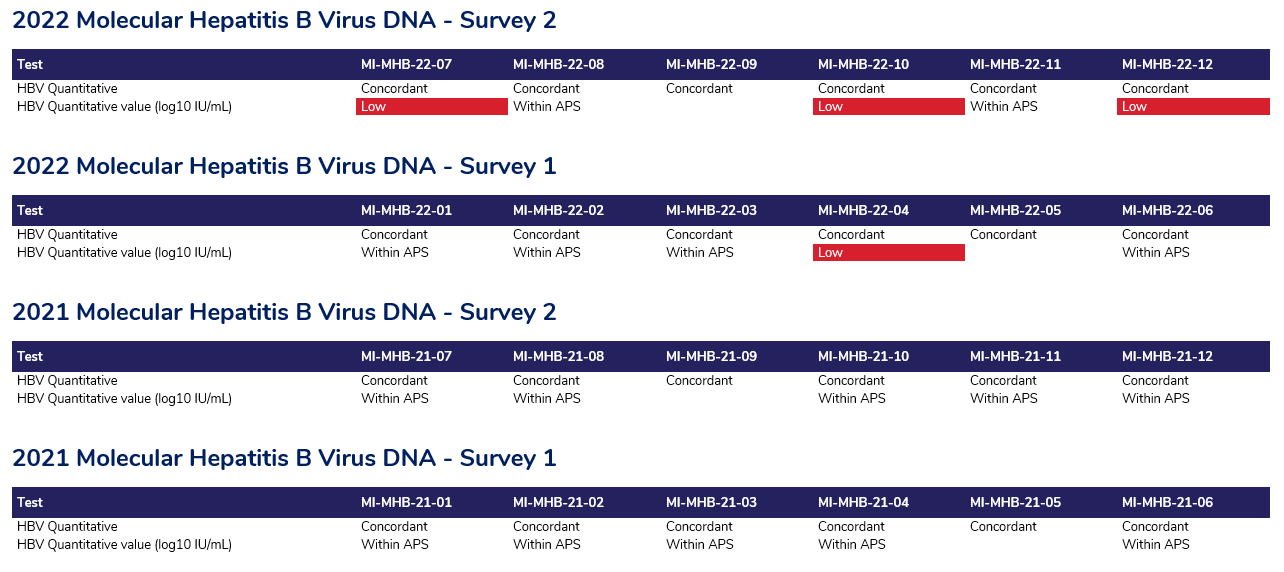
Cumulative assessment – this table shows cumulative performance over the year and previous years, to allow for the review of trends over time.

Survey reports that assess Qualitative & Quantitative measurands
The survey report structure for these measurands remains the same by displaying the Summary of Performance, Result Review, commentary, and cumulative performance.
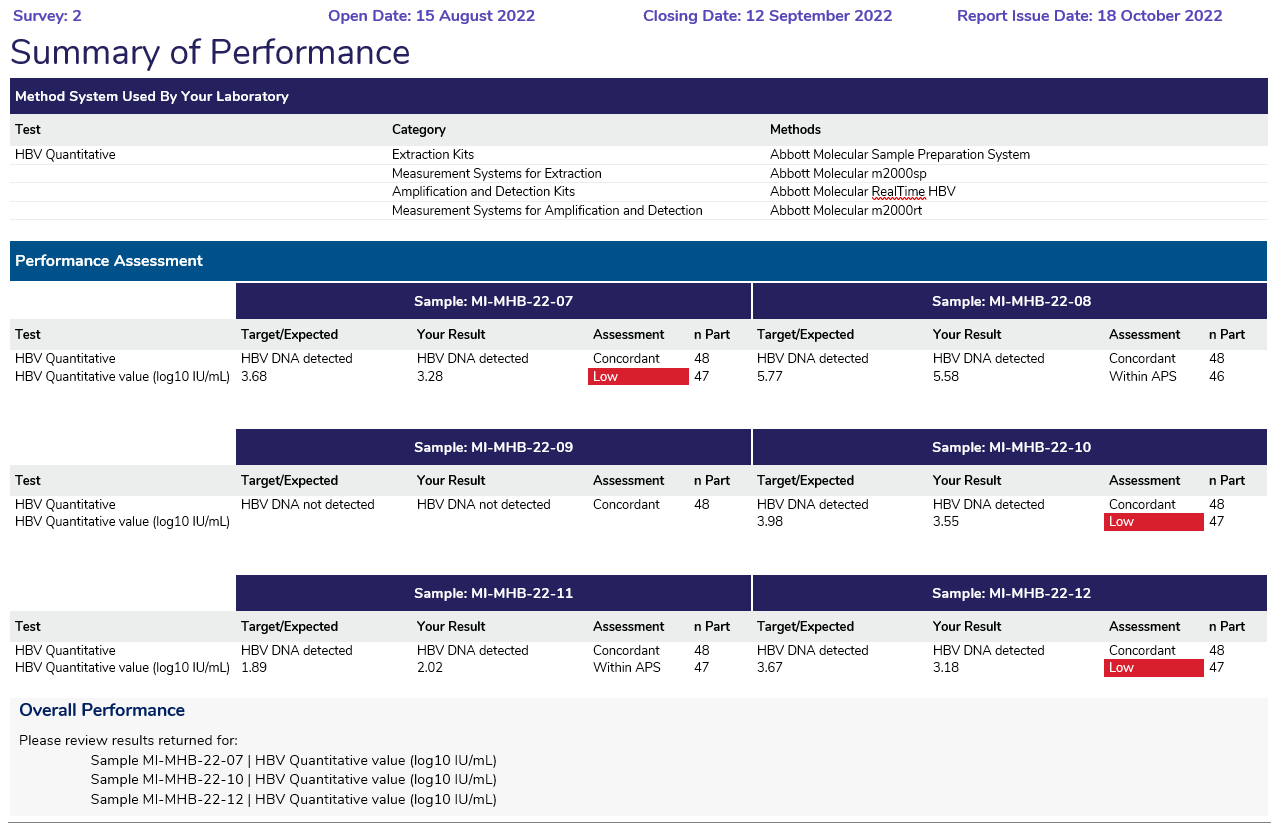
Summary of Performance – The summary of performance provides a snapshot of participation and assessment in the program. This section shows a table for the ‘method system used by the participant, the ‘expected results’ for each sample and the ‘performance assessment’. The summary also lists the expected results, your result, the assessment, total number of participants performing the test and displays the test method performed by the participant.
The assessment for qualitative results is based on the target (expected result). The assessment for quantitative results is based on Analytical Performance Specifications (APS), a generic term that can be applied to any measurand that uses ranges. In these programs the allocation of the range or APS is set at ±0.25 of the median log10 IU/mL (or copies/mL) value. The median value is determined using all participant results. The APS range is applied to these median results for comparison. Results outside the APS ranges will be indicated on the report.
The nomenclature currently in use for the assessment for these programs is as follows, however also includes the qualitative nomenclature as previously listed.
Within APS: The quantitative value is within the APS range
Low: The quantitative log10 value is lower than the APS range (-0.25 of the median)
High: The quantitative log10 value is higher than the APS range (+0.25 of the median)
Result Review – The survey results for each sample are presented on separate pages. Each survey sample will highlight the qualitative results displayed as a bar graph and a scatter plot adjacent to it, displaying the quantitative results (reported as Ct values) as reported by all participants. The quantitative results for this component of the survey are not assessed, however a breakdown of the statistical analysis of methods is provided to highlight the performance across methods.
An additional page is provided for the quantitative component of the results, showing a scatter plot of the overall log10 IU/mL (or copies/mL) value results and a scatter plot of specific method results for direct comparison. This page also provides a table showing a breakdown of all assays in use and the results obtained.


Commentary – Provides a review of the survey results obtained for each sample. Suggestions and recommendations are provided for follow-up investigation and also some further reading for educational purposes.

Cumulative assessment – This table shows cumulative performance over the year and previous years, to allow for the review of trends over time.
Program Survey reports that require Grading
The survey reports are structured to provide participants with a Summary of Performance, Result Review, commentary, and cumulative performance.
Summary of Performance – The summary of performance provides a snapshot of participation and assessment in the program. This section shows a table for the ‘method system used by a participant, the ‘expected results’ for each sample and the ‘performance assessment’. The summary also lists the expected results, your result, the assessment, total number of participants performing the test and displays the test method performed by the participant.
The assessment of qualitative and genotype (identification) results in these programs are based on the target (expected result) and is graded according to the capability of your assay. For example, if your assay cannot detect or identify low-risk types then a result of ‘not detected’ is concordant to the expected result for the assay.
The following nomenclature is currently in use for assessment
Concordant: Matches the target or expected result
Minor Discordance: A result that may have partial agreement to the target result
Discordant: Does not match the target response
Not Assessed: The result not within the assay capability or is beyond the scope of acceptance for grading
No Participation: The participant failed to take part in the survey

Result Review – The results for each sample are presented on a separate page, displaying a bar graph of the qualitative result returned as compared to all other participants and those using the same method. A scatter plot is also provided to display quantitative results returned, which are compared to all other participants reporting a Ct value. These results are not assessed but can give an indication of performance. An additional bar graph below these graphs displays the responses for the Final Interpretation, where the target responses are highlighted as grey bars and the non-target responses are highlighted in red.
The method performance is also provided in a table, showing a breakdown of all assays in use and the results obtained.
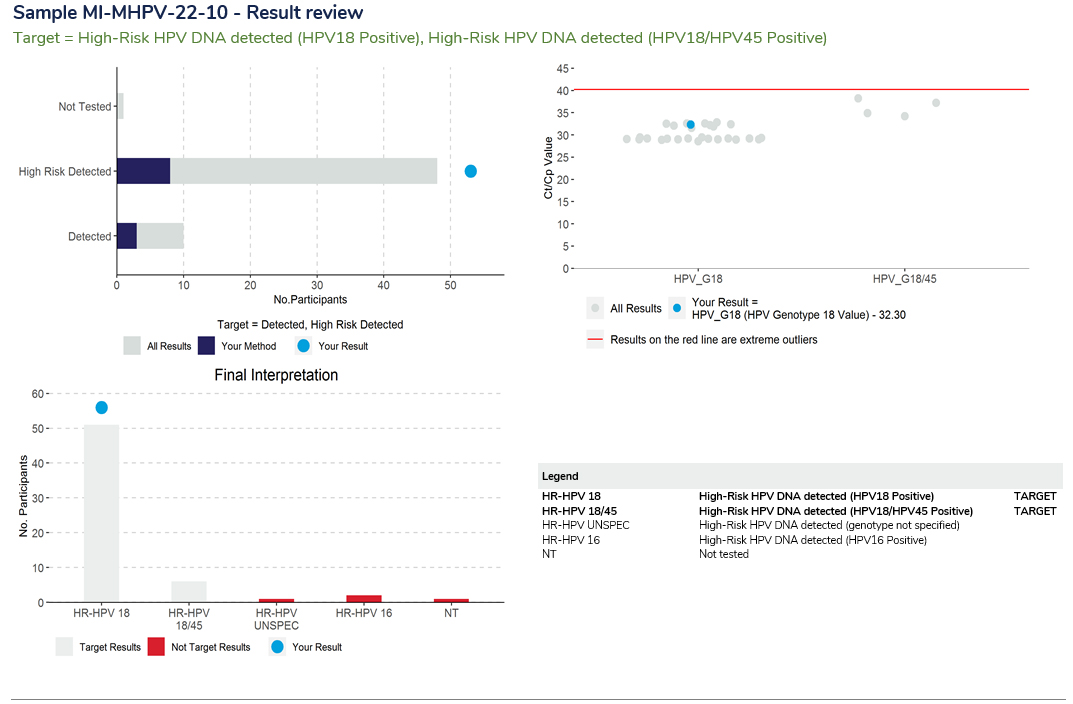

Comment/Review – A review of the aims of the survey and the results obtained are provided in the comment/review section. Suggestions and recommendations are provided for follow-up or investigation and also some further reading for educational purposes.

Cumulative assessment – This table shows cumulative performance over the year and previous years, to allow for the review of trends over time.
