Introduction
The Serology discipline programs are structured to analyse survey results and assess performance. The report format has been updated to follow a standard structure used by all programs offered by the RCPAQAP.
The following information provides participants with a guide to understand the data analysis system used to assess participant performance.
Participant Performance
The RCPAQAP Serology proficiency testing programs provided to participants are designed to facilitate monitoring methods that detect and/or measure levels of antibodies and/or antigens within a sample as a result of exposure to a bacteria or virus.
While the expected results for survey samples (based on pre-testing) are known to RCPAQAP Serology, overall participant performance is based on consensus of all results returned for the interpretative (qualitative) component of the program. The quantitative component of the survey is also reviewed to assess the variation seen by individual methods currently being used to detect the antibodies and /or antigens in the program.
Analysis of results
Analysis of Qualitative results
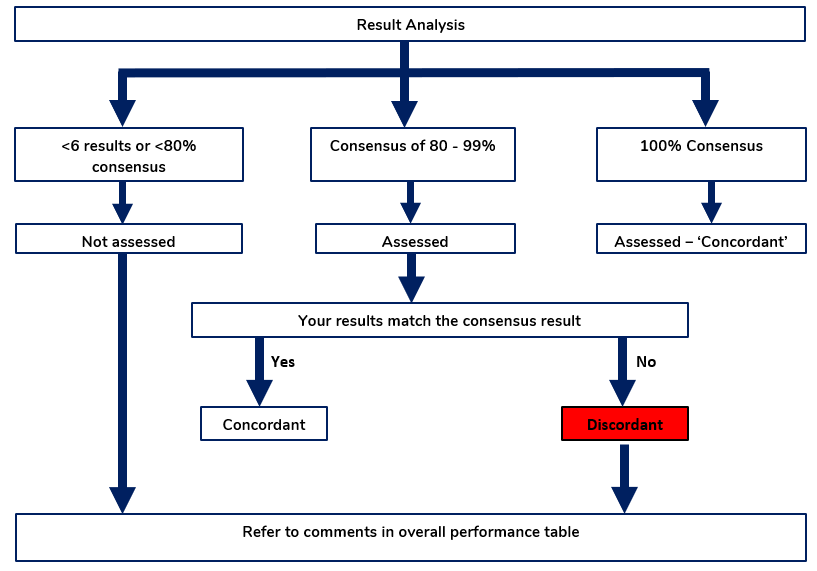
The expected results for all qualitative survey results (e.g. Positive/Negative) are determined from the consensus of all results. Results are only assessed where ≥ 80% of participants return the same value and provided there are 6 or more results.
- If a test achieves ≥80% consensus/agreement from 6 or more results, this is then listed as the expected value. Participants who return the expected value are assessed as “CONCORDANT”
- If a test achieves ≥80% consensus from 6 or more results, participants in the minority group are assessed as inconsistent from the consensus and their results are listed as “DISCORDANT”.
- When <80% or < 6 labs agree, the uncertainty of the results increases so no assessment is made and all results are reported as “NOT ASSESSED”.
Analysis of Quantitative Results
Quantitative analysis is performed on all tests where a numerical result is provided (e.g. S/CO). Results are illustrated in a scatterplot for all methods. The scatterplot illustrates the median value and an indicator of the upper and lower (+/- 3SD) range. Participants should troubleshoot results that lie outside the upper and lower range.
Criteria for assessment of qualitative participant results

Participants should investigate all non-assessed or discordant results using their internal quality system. Participants should form their conclusions on each method’s performance based on the accumulation of data and information that is supplied in the survey, the report commentary, raw data and other information available to the participant.
To assist in troubleshooting non-assessed or discordant results, the following should be considered:
- Are discordant results method group (kit) related?
- Are your results discordant compared to others in your method group?
- Are discordant results related to your analytical principle?
- Are discordant results lot number related?
- Has the specimen type been validated for the method?
- Do the results appear to be related to sensitivity/specificity?
- If this was a duplicate sample from a previous survey (as noted in the commentary) with discordant results were your results previously concordant?
Survey Reports
The RCPAQAP Serology report format follows the standard structure that has been adopted by other programs offered by the RCPAQAP. This single report replaces the previous generic and survey reports.
The structure of the new reports provides participants with a summary of performance, a review of the performance of participants’ results, a method breakdown review with commentary and cumulative performance.
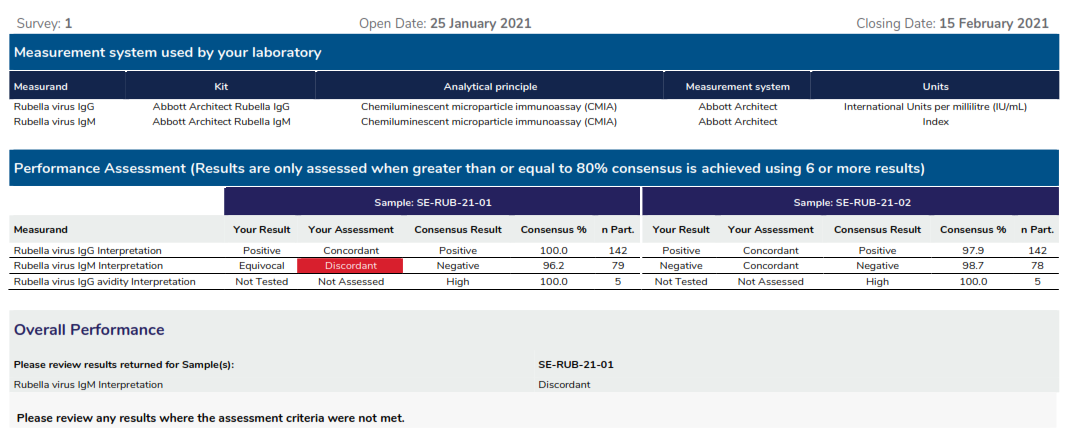
An example of the report can be seen below:
1. Summary of Performance

Measurement system used by your laboratory: Lists the measurement system returned at result entry in the myQAP portal.
Performance assessment: Provides the assessment of your results against the consensus of 80% of all participants returning the same qualitative value for the measurand. Only qualitative results are assessed. Quantitative results are currently not assessed, although statistical analysis is provided for user groups of 6 or more quantitative data.
Consensus result: The consensus result represents the qualitative result returned by the majority of laboratories for a sample. 80% consensus must be reached by more than 6 laboratories to assess performance.
Overall Performance: Provides a comment on the overall performance of this survey.
2. Result Review

- Result histograms: Includes all qualitative results returned for each sample. The report lists individual results, the consensus result and the per cent consensus achieved. Highlights the number of results for each method group.

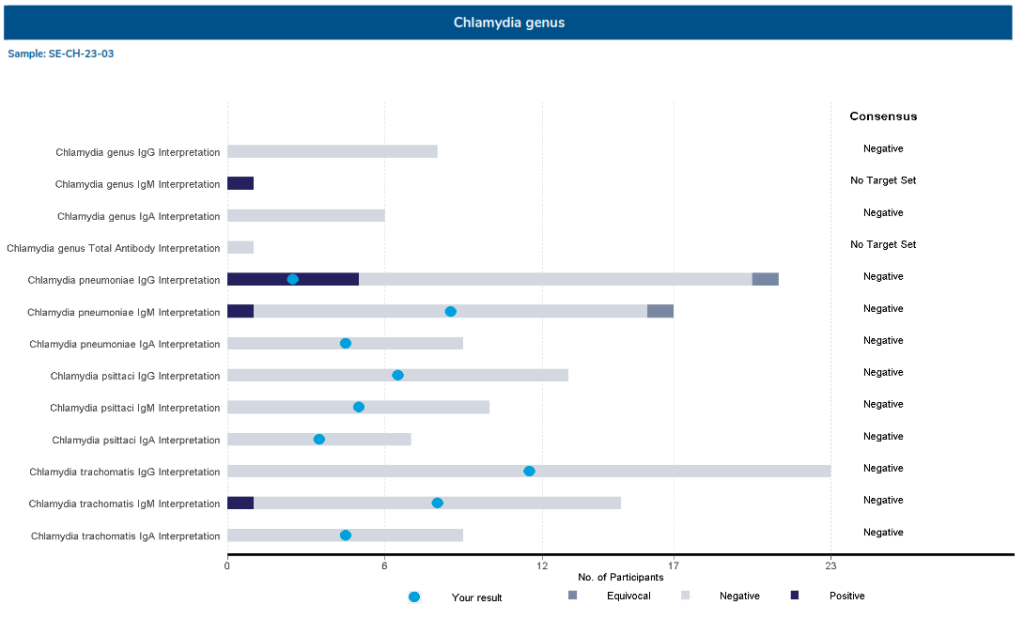
- Stacked Bar Graph: includes all qualitative results returned for each sample. This graph is included in measurand dense programs (e.g. Epstein Barr Virus, Syphilis and Flavivirus). The graph highlights the number of results, consensus value and result achieve for each measurand.

- Kit Performance: Provides a breakdown of the results returned from participants based on the ‘kits’ used to perform the assigned tests. Lists the number of participants returning a qualitative result along with the method consensus.

Quantitative results are illustrated in a scatterplot for your specific method group (participants using the same kit). Exclusion of outlier results from your method group may result in differences in the qualitative and quantitative number of results.
Results highlighted in blue within the table of results indicate the method used within your laboratory.
A red line above or below the scatter plot represents 4SD (4 standard deviations) from the mean. Results that lie on or outside the red line represent results that are equal to, or greater than 4SD).

3. Interpretation
Provides a breakdown of all the responses received for the result interpretation. This provides the total number of participants who returned each response, and as a percentage of the total, for that response. The percentage is based on the total number of participants and not the total number of comments.
The blue dots above the histogram represents the responses that you have returned. Note, the interpretation is not assessed performance.
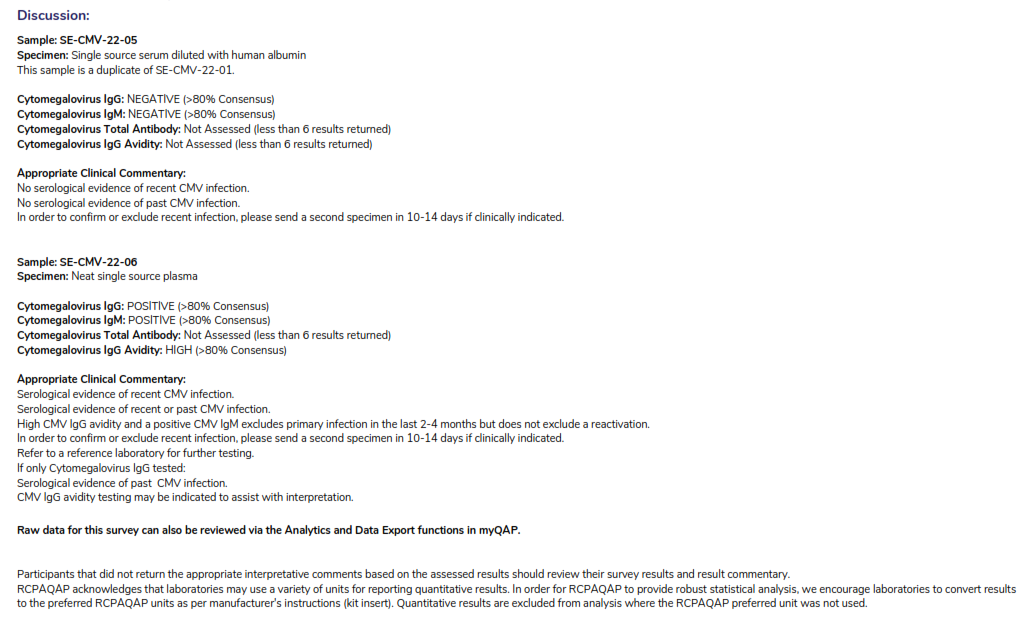
4. Commentary

Provides comments based on the overall survey performance. These are prepared by the Serology Team after reviewing all participant data. We recommend participants review data through the analytics and data export functionalities.
5. Cumulative Performance
Provides the assessment of performance for each qualitative test performed by the laboratory for the current year. The number of surveys displayed is determined by the survey schedule.
6. Z-scores
The z-score is an integer that represents the number of standard deviations your result is from the mean result. This has been included as a guide so that participants can monitor their performance against their peer group for the quantitative results returned.
Assessment Criteria
- Results are assessed as Concordant, Discordant and Not Assessed
- When ≥ 6 results achieve 80% consensus, the sample will be assessed
- When < 6 results are received or <80% consensus is achieved, the sample will be reported as “Not assessed”
- Provided that the consensus result is ≥ 80% – A laboratory obtaining the same result as the consensus will be reported as – Concordant
- Provided that the consensus result is ≥ 80% – A laboratory that is inconsistent with the consensus results – Discordant
- Quantitative Data – does not get assessed but statistical analysis (Median, SD, CV) is provided where ≥ 6 data points per user group are received. Mean and median values are provided where there is more than three quantitative values returned within the method group.